

Instead of jumping into a stock everyone is piling into, consider following a methodical approach to trade momentum stocks.

Photo by Dan Saelinger
Key Takeaways
- Learn how to use a three-step process to identify potential momentum stocks
- Start by identifying what you might want to trade, where in the trend a stock could be, and when you would potentially want to get in
- Understand how to use multiple-time-frame chart analysis when making potential trading decisions
Warren Buffett once said, “Investing is not a game where the guy with the 160 IQ beats the guy with the 130 IQ. Once you have ordinary intelligence, what you need is the temperament to control the urges that get other people into trouble.” That’s sage advice for the meme-stock-trading crowd that emerged in 2020.
This new group of traders introduced a type of momentum that’s been atypical in the financial markets. First, traders hear about a stock that’s getting a lot of buzz from an online trading group. The FOMO (fear of missing out) and YOLO (you only live once) crowds decide to go for it. A bunch of traders band together, jump into the stock, and push prices higher. This continues until enough sellers show up to reverse the price move.
Mashed together, FOMO and YOLO can create momentum or MOMO—but it’s not the typical kind. When you jump into a trade based on rumors or chatroom gossip, it’s usually not a viable momentum-based trading strategy. It’s just herd-mentality guessing.
Make a Plan
In theory, MOMO trading can be a long- or short-term strategy. If there’s enough juice for a price move to continue, it could be worth jumping in. Momentum traders typically start following a trend when a stock shows signs of strength, and they exit the trade when momentum starts to slow. How is this different from the momentum behind a FOMO trade?
Well, MOMO trading isn’t about buying low and selling high—nor about jumping into a trade on a price move that has no fundamental basis. It’s more about looking at how strong a trend is, waiting for a setup, and getting in to take advantage of that strength.
If you feel tempted to jump into a trade that’s seemingly fueled primarily by internet rumors, first take a step back and figure out whether the price move may still have room to run. It’s no fun getting into a trade at the tail end of its move.
A FOMO or YOLO trade is likely to look like the chart in figure 1—short and quick. Sure, it’s easy to see in hindsight. But in real-time trading, it might look like any momentum trade. How do you know the difference? The real test lies in the sustainability of a price movement, and that means waiting for a setup to appear on the charts. Yes, you may have to be patient. But you’ll be grateful in the long run.
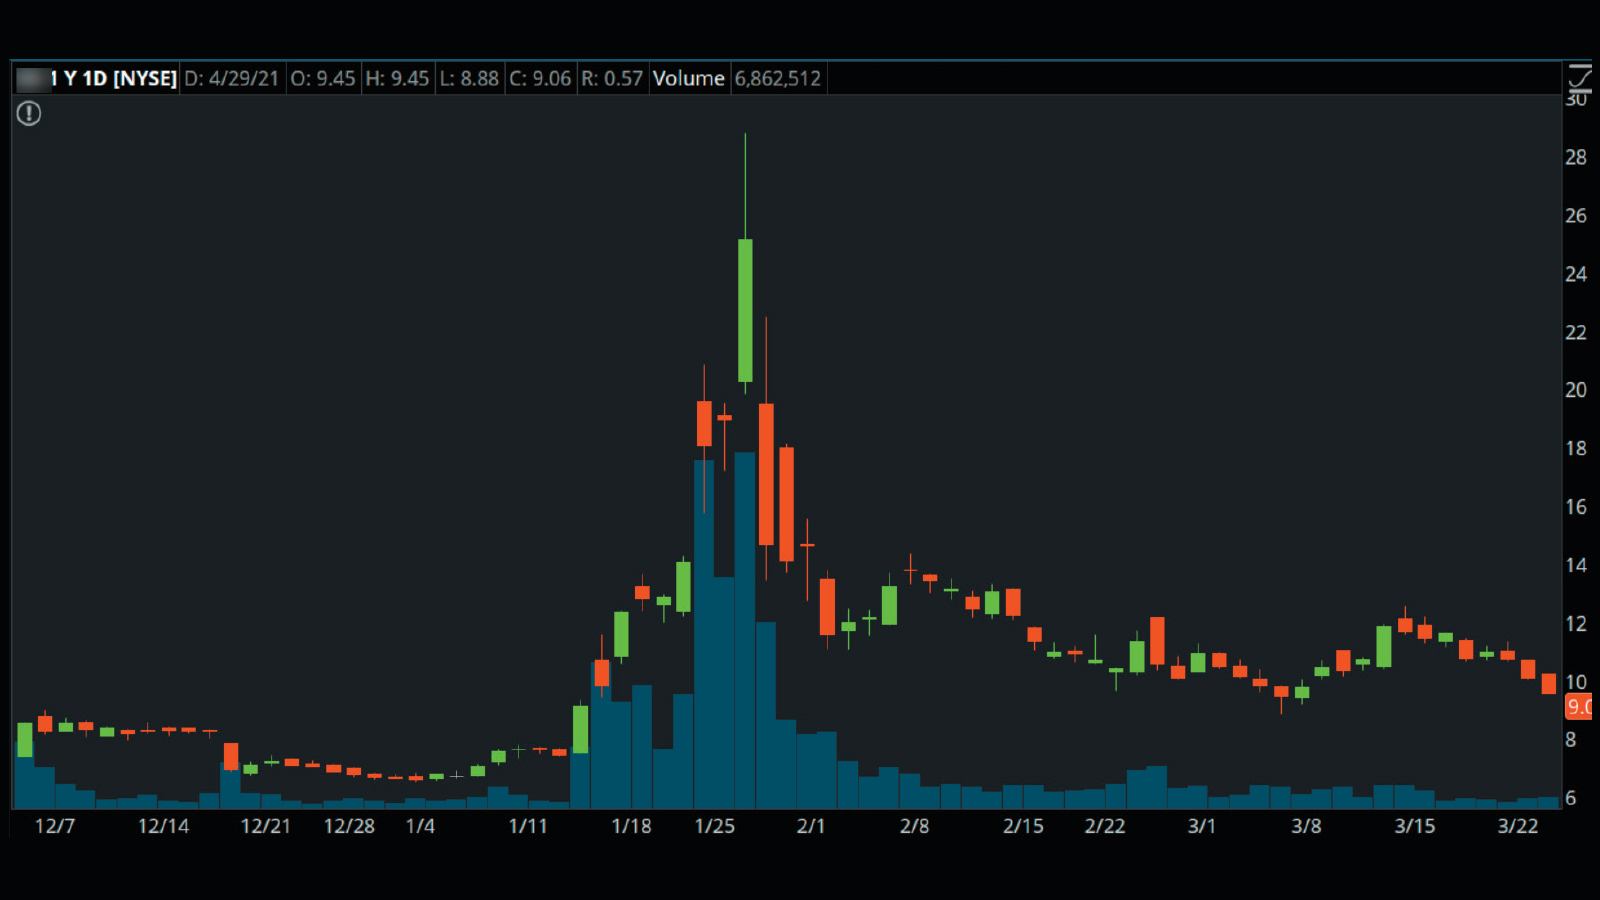
FIGURE 1: SHORT AND SWEET. It may be tempting to trade sharp breakouts on heavy volume (center), but they tend to be short-lived. If you’re lucky, you may capture some profit. But there’s no guarantee. Chart source: The thinkorswim® platform. For illustrative purposes only. Past performance does not guarantee future results.
Market, Sector, Generals, Soldiers
Figuring out whether a trend is sustainable is a challenge if you’re also juggling fear and greed. Consider a three-tiered, top-down approach to help you view momentum more strategically. It all starts with asking three questions.
1. What do you want to trade?
Before placing a trade, get an overall view of the market. Here’s a good place to start:
- Fire up the thinkorswim platform.
- Select the MarketWatch tab.
- Select Visualize in the submenu to get a heat map of the broader market.
- Select Indices (listed under All Watchlists).
- Expand each index to see how sectors are performing.
This gives you a visual idea of which sectors might be outperforming or underperforming on any given trading day.
Once you’ve figured out which sectors you might want to trade, identify a handful of stocks that are potential trading candidates. If a specific sector is outperforming, you want to look for individual stocks within the sectors that are moving in sync. Think of them as the generals.
While still in the heat map, do a quick analysis to see if any key stocks are showing signs of momentum and are likely in the early stages of a trend. Then select any of the symbols and go to More info on symbol > Quick Chart. These are the stocks you might add to your watchlist. Think of them as the soldiers.
2. Where in the trend are you?
There’s no right or wrong way to identify a trend. But there are different tools that can help you figure out if the trend is beginning, developing, or maturing. Some drawing tools to consider include price channels, support and resistance levels, and volume. You can find all these on the Charts tab on thinkorswim under Drawings > Drawing Tools.
It’s best to start with a longer-term chart that goes back six months or a year. Figure 2 is a one-year chart that clearly shows an upward channel. Let’s walk through the early stages of this channel to determine when you might potentially enter a trade.
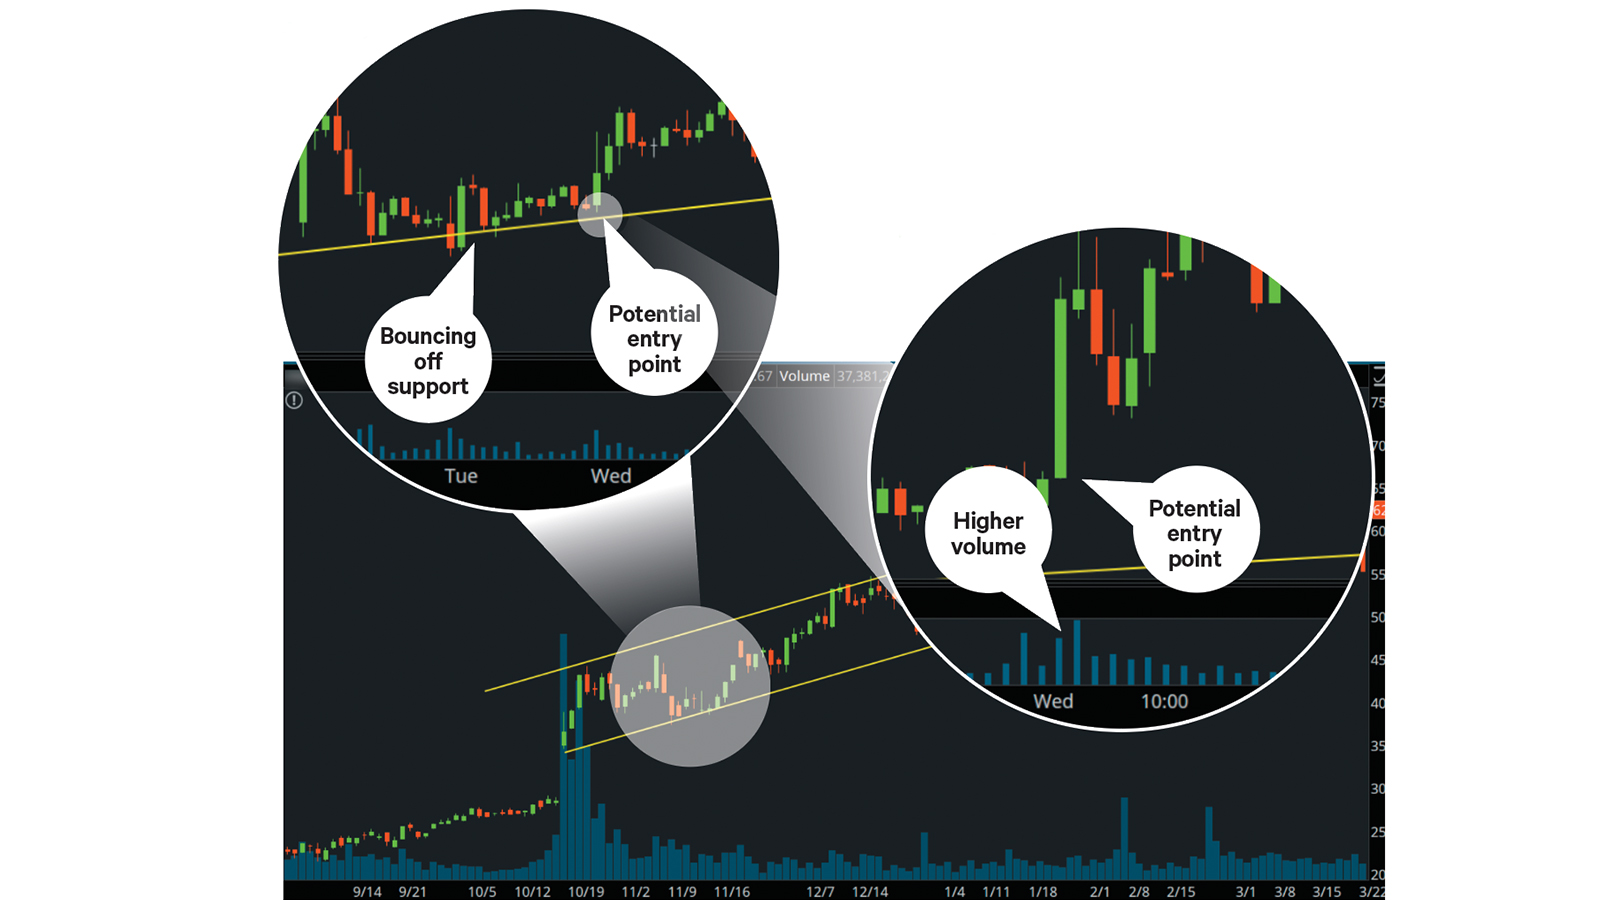
FIGURE 2: IDENTIFYING MOMENTUM, FOCUS ON SHORTER TIME FRAME, PINPOINT ENTRY. How do you determine if a momentum move might sustain? On thinkorswim, change the time frame on chart from Daily to Intraday and set it to 30m. To decide on a potential entry point, use an even shorter time frame. You could set the aggregation period to 5m. Chart source: The thinkorswim platform. For illustrative purposes only. Past performance does not guarantee future results.
3. When do you get in?
There’s no perfect time to enter a trade; however, using multiple time frames for your charts can help you choose. First, start with a longer-term chart. The starting time frame depends on whether you’re a short- or long-term trader. It should go back just far enough to see which way prices are trending and if they’re doing so with enough momentum.
Going back to figure 2, in mid-October, the gap up on heavy volume would’ve been the first indication of a momentum opportunity. But to avoid false signals, don’t jump in at the first sign. Instead, dig deeper to see if this is likely to be a short-term move or if it signals longer-term momentum by zooming in on shorter-term charts.
Next you could zoom in on a 30-minute chart for the day price bounced off support, plus the following few days. Does the trend coincide with what you saw on the daily chart? In this case, it does. But let’s take it one chart further to confirm.
Pull up an even shorter time frame, such as a five-minute chart. Notice that when price bounced off the trendline, it did so on higher-than-average volume—a good sign confirming the trend’s momentum. From this point, bounces off support levels, high-volume price spikes, and so on may be entry points to consider.
When Do You Get Out?
That all depends on how price progresses. At some point, you may be able to extend your channel to the right. The upper-channel line could function as a resistance level, or there may be other resistance levels (such as previous highs) that you might use to help decide when to exit the trade. In this example, price moved in an upward channel. A breakout above the upper channel on high volume could potentially be an exit point.
Of course, it’s always wise to consider setting a stop order below significant support levels. That way, if price should move in the opposite direction, you’re better prepared to reduce downside risk.
Following this three-step, multi-time-frame approach when planning your trades could help prevent you from making hasty decisions. And analyzing price movement from different perspectives may give you a more objective view. This, in turn, could help you trade more logically and ultimately help prevent you from following the wrong crowd.
Jayanthi Gopalakrishnan is not a representative of TD Ameritrade, Inc. The material, views, and opinions expressed in this article are solely those of the author and may not be reflective of those held by TD Ameritrade, Inc.
"Trading" - Google News
September 27, 2021 at 09:15PM
https://ift.tt/2XUXGBV
The Nuts and Bolts of MOMO Trading - The Ticker Tape
"Trading" - Google News
https://ift.tt/2tBJjTS
https://ift.tt/3djUFhc
Bagikan Berita Ini


0 Response to "The Nuts and Bolts of MOMO Trading - The Ticker Tape"
Post a Comment